
What’s the Fed got do with it?
It is that time again. The Federal Reserve [1] cut interest rates, which creates a lot of misconceptions about mortgage rates and lending rates. The Federal Funds Rate [2] was cut by 1.25% over the weekend to a range of 0.00% to 0.25%. You might think this means a 30-year mortgage [3] dropped to zero or even by an additional 1.25%. Although it is easy to presume these rates would follow the actions of the Federal Reserve, it isn’t necessarily true. There are a variety of different types of mortgages, which include ARM’s and shorter- term fixed products. I hope to focus in on one of the most popular mortgages, the 30 year fixed and help you better understand the role of the Federal Reserve, their influence on rates, and what matters most when considering the direction of interest rates for lending products.
The Federal Funds Rate
This is the overnight lending rate banks charge other banks for excess reserves. By raising or lowering rates, the Federal Reserve is trying to slow the economy or stimulate the economy through this rate, making money cheaper or more expensive to borrow. The change in rates does not have an immediate effect on the economy, but generally takes six months or longer before we see the rate change effect the economy.
Longer Term Treasury Rates
The Federal Funds Rate can have an indirect relationship on 30-year mortgage rates. The rate should be paying attention to, however, are longer term treasury rates, such as the 10-year Treasury [4]. Treasury bonds [5] are considered one of the safest investments one can make. The 10-year Treasury and mortgage rates are intimately linked and generally move in tandem together.
Market Participants determine Rates
If you’ve been following mortgage rates, you will notice that rates have been dropping since the end of 2018, while the Federal Reserve only started lowering their rate at the beginning of August of 2019. Investors in bonds, sensing a slowdown in economic activity, already were lowering interest rates by their increased demand for safe assets, such as longer-term US Treasuries. In essence, market participants were anticipating lower interest rates later put in effect by the Federal Reserve.
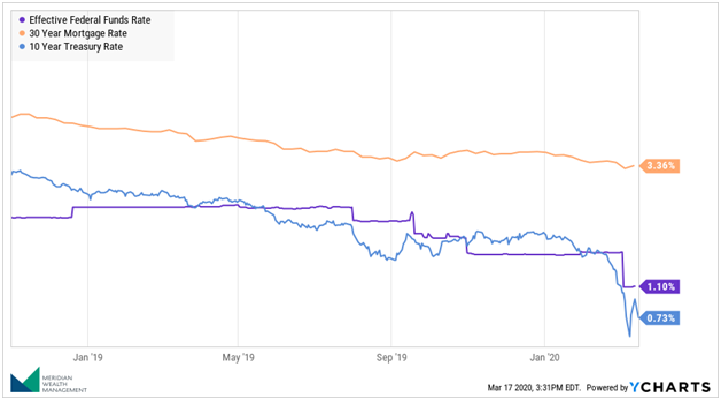
Source: Freddie Mac [6], Department of Treasury [7], Federal Reserve [8] Dates November 1, 2018 through March 16, 2020, shown in log scale.
The Shape of the Curve
Interest rates do not all behave the same way. People making generic statements, such as rates are going up or down are not accurately describing rates. Rates are complex, there’s varying credit qualities, maturities and covenants. To evaluate rates across maturities, one should start with the Treasury Yield Curve [9, 10], which plots the various maturities with their corresponding rates. Typically, in a healthy economy shorter term bonds carry lower yields than longer term bonds. This is a reflection of the uncertainty and risk that exists in owning debt 7, 10 and even 30 years out. The yield curve and the shape of the yield curve is a more accurate representation about investor’s sentiment on risk and rates.

A normal yield curve slopes upward from left to right on a graph. As maturities lengthen to the right, yield should also increase.
At other times the curve might be flat, steep or even inverted. With a flat curve, there isn’t a significant difference in yield when buying a 5-year bond or 10 year bond. This would reflect a slow economy. A steep curve would reflect a strong, growing economy with higher inflation expectations and a demand for a higher interest rate. In an inverted yield curve, shorter term rates are higher than longer term rates, which reflects a growing sentiment of lower economic growth or deflation.
Why is the shape of the curve important? How could it effect current mortgage rates? How does the Federal Reserve lowering interest rates effect borrowing?
The shape of the curve tells us the general sentiment about how bond investors see economic growth. A curve that is flattening or becoming inverted signals a belief in an economic slowdown. Prior to the rate cut, mortgage rates were already falling. By the Federal Reserve lowering short term rates [2], it may cause longer term mortgage rates to fall further, but it might not. It is entirely possible that mortgage rates go higher at some point in the near future. Remember, at some point, by lowering the Fed Funds rate, it is supposed to stimulate the economy. What happens when an economy starts growing? The yield curve begins to steepen, which means longer term rates begin to rise. This happens well in advance of the Fed actually raising their rate. How soon this happens is really dependent on market sentiment and how quick of a rebound the investors are anticipating.
The Spread
Over the last month the ten-year Treasury has dropped precipitously, trading well below 1%. Typically, a 30-year mortgage trades 1.6% to 1.8% above the 10-year, which is the spread [11] or difference in rates. With the large drop in treasuries, why haven’t we seen the spread stay the same? The spread can be effected by a variety of different factors. Investors could be paying a premium for safety, making treasury rates significantly lower, making the spread (the difference) wider. On the other side of the safety premium is the risk of a mortgage versus a treasury. Since the risk is increasing in times of stress, this would also lead to the spread widening. The spread narrowing and widening is a reflection of risk existing between the two rates.
Supply/Demand
Earlier I pointed out how buyers of Treasuries can lower rates with increased demand. The same is true for mortgages. If the demand to refinance is high, lenders have to have the reserves available to lend. Lenders can’t lend out money they don’t have, keeping mortgage rates elevated as demand is processed.
Should I refinance?
Despite people using generic terms, like interest rates are going up or down, predicting the direction of interest rates is complicated and nearly impossible. Almost a year ago, some of the most astute investors in the world were predicting rates going up this year. A year later, we find the opposite to be true as rates fall.
Determining whether to refinance debt or buy a property comes down to your personal situation. You should consider how long you plan on owning the property, the impact on your cash flow [12], cost of the loan [13], payback period [14], and the impact of re-amortizing [15] a loan by extending the term. The totality of these questions in the context of your personal financial situation should be evaluated thoroughly before making this decision.
Definitions and Footnotes
Data provided through YCharts. 2020 YCharts, Inc. All Rights Reserved. YCharts, Inc. (‘YCharts’) is not registered with the U.S. Securities and Exchange Commission (or with the securities regulatory authority or body of any state or anyother jurisdiction) as an investment adviser, broker-dealer or in any other capacity, and does not purport to provide investment advice or make investment recommendations.
This data has been generated from YCharts.com and is intended solely to assist you or your investment or other adviser(s) in conducting investment research. You should not construe this report as an offer to buy or sell, as a solicitation of an offer to buy or sell, or as a recommendation to buy, sell, hold or trade, any security or other financial instrument. For further information regarding your use of this report, please go to:https://get.ycharts.com/disclosure/
Disclaimers
Meridian Wealth Management, LLC is a registered investment adviser in Washington and certain other states. The advisor may not transact business in states where it is not appropriately registered, excluded or exempted for registration.
Individualized responses to persons that involve either the effecting of transactions in securities, or the rendering of personalize investment advice for compensation will not be made without registration or exemption
The information provided here is for general informational purposes only and should not be considered an individualized recommendation or personalized investment advice. The strategies mentioned here may not be suitable for everyone. Each investor needs to review an investment strategy for his or her own particular situation before making any investment decision.
Please note that this content was created as of the specific date indicated and reflects the author’s views as of that date. It will be kept solely for historical purposes, and the author’s opinions may change, without notice, in reaction to shifting economic, market, business, and other conditions.
This content is for informational purposes only and does not constitute a complete description of interest rates. Information provided regarding market, interest rates and other financial information is obtained from sources which we and our suppliers believe to be reliable, but we do not warrant or guarantee the timeliness or accuracy of this information.
